01
COM method calls
Trace observed interface methods with supported signatures, including available inputs, outputs, HRESULTs, thread IDs, timings and optional call stacks.
BEYOND COM ACTIVATIONWINDOWS DEVELOPER UTILITY / BY BBSOFT LLC
Version 1.6.0 · Windows x64
See the COM methods your application calls, with available arguments, return values and stacks. Discover custom interfaces from type libraries, resolve Automation names, and optionally follow DLL function calls.
01 / INSIDE THE APPLICATION
Attach to a running x64 process or launch it with tracing active. Inspect method calls as they arrive, filter the trace, and export JSONL for later analysis. Minimize to the system tray to keep a capture running.
02 / WHAT YOU CAN TRACE
Trace observed interface methods with supported signatures, including available inputs, outputs, HRESULTs, thread IDs, timings and optional call stacks.
BEYOND COM ACTIVATIONDiscover embedded type libraries in loaded EXEs and DLLs, import .tlb or .olb files, and browse which libraries supplied each interface and method.
DISCOVER & IMPORTResolve IDispatch members from type information and observed name lookups. Recognized interface IDs gain friendly names from a Windows catalog and the registry.
MAKE THE TRACE READABLEOptionally trace regular imports, delay-loaded functions and executable exports obtained through GetProcAddress, by name or ordinal.
EXE & SELECTED CALLING DLLSFilter by method, IID or argument value. Pause recording, follow the latest events, inspect details and save the trace as JSONL.
KEEP USEFUL CONTEXTKeep tracing from the system tray. Closing COMTracer removes its hooks and unloads the tracing DLL after active hook callbacks finish.
LEAVE THE HOST RUNNINGCOM capture depends on observing an interface and having a supported signature. Unknown signatures can be supplied in a profile. Optional DLL function traces record entry, caller and stack information; they do not decode unknown arguments or return values.
03 / FROM THE APPLICATION
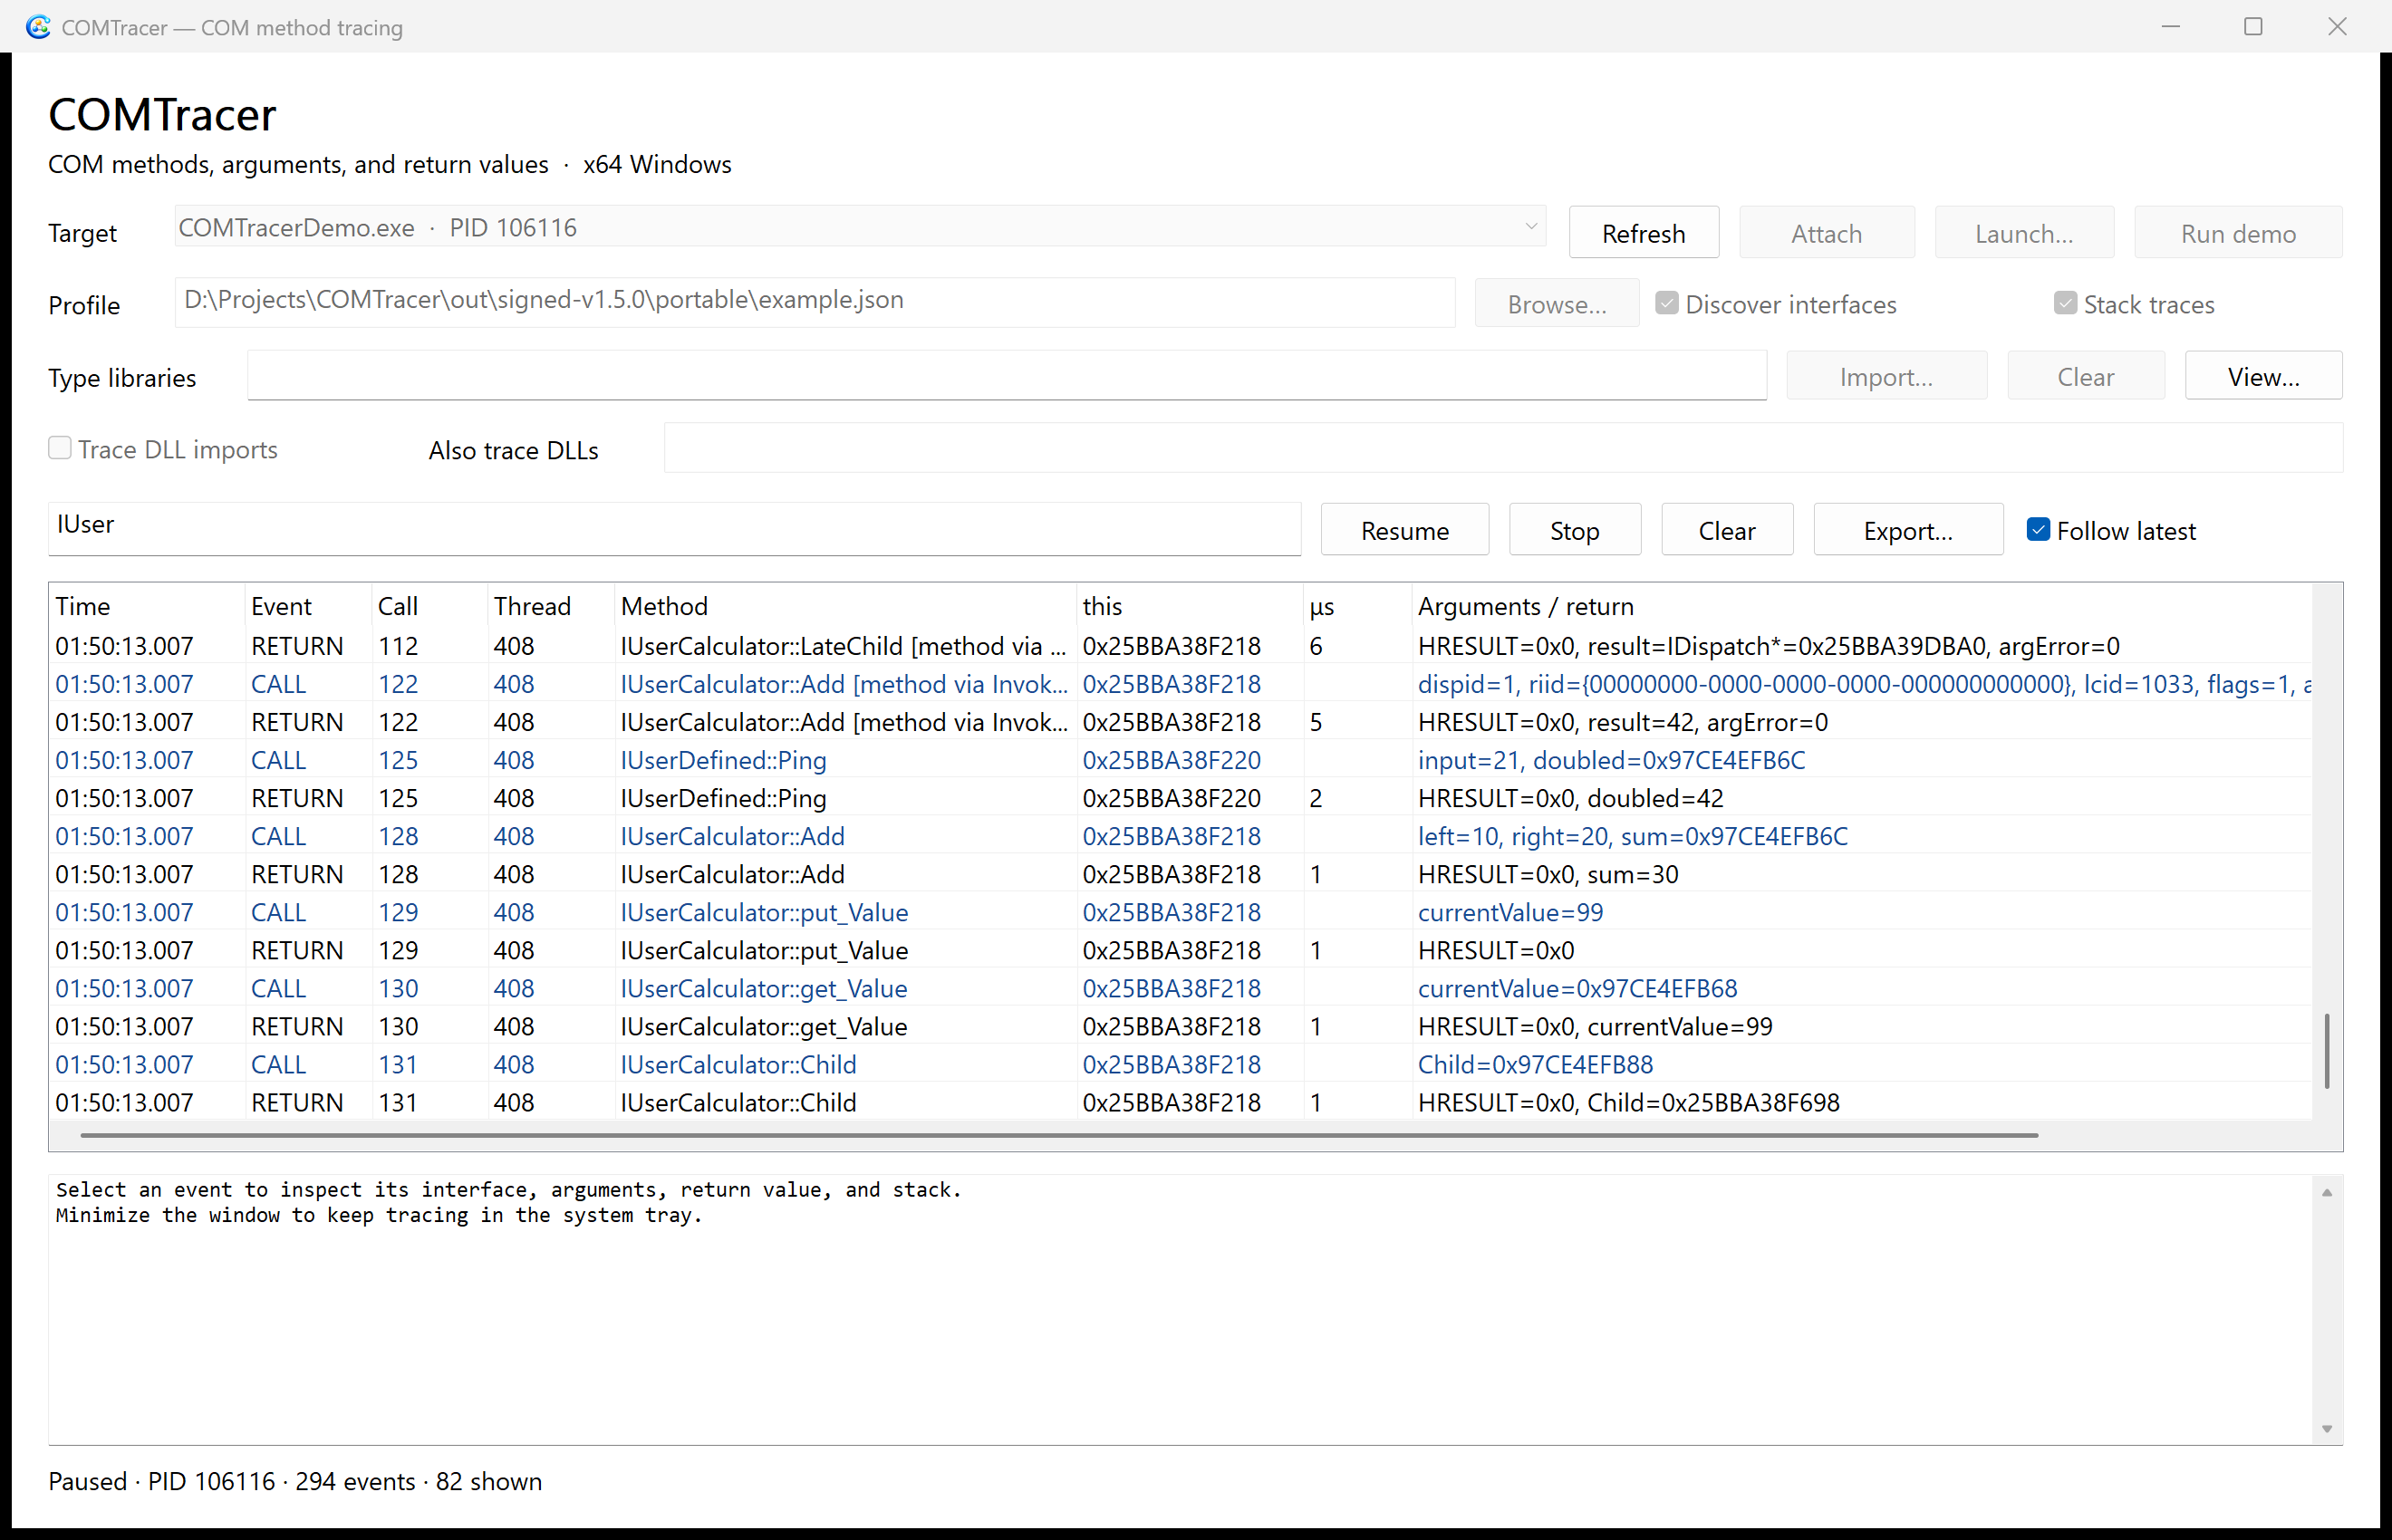
Available inputs, output values and HRESULTs stay alongside each call.
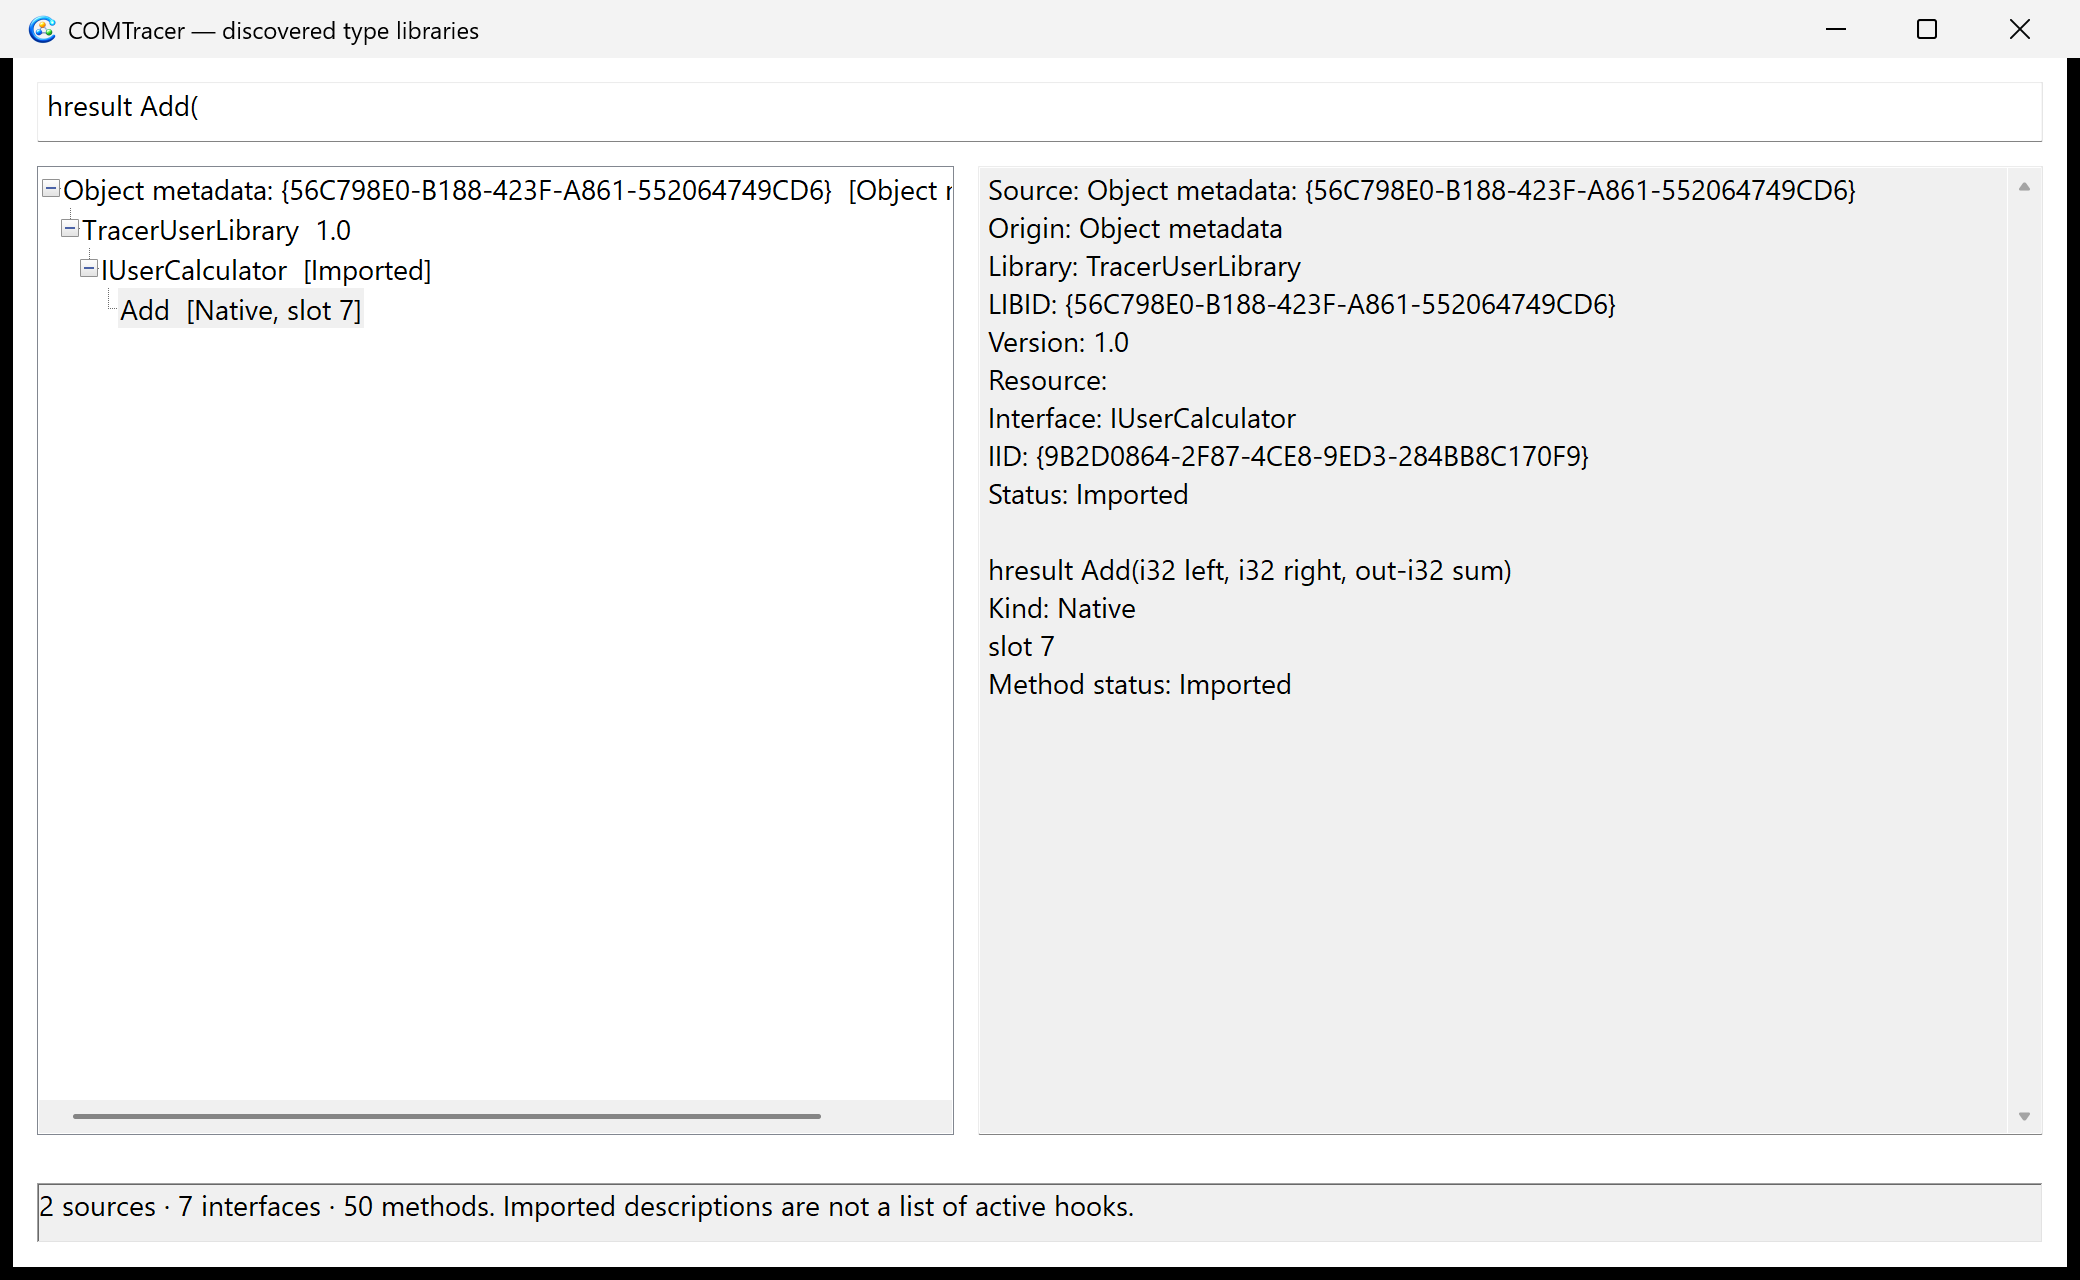
See which source provided each imported interface and method.
The desktop utility captures and exports traces on your machine.
View the type-library browser screenshot → Both screenshots use the included demo application.
04 / DOWNLOAD
01 / INSTALLER
x64 · Signed MSI
Windows 10 version 1709 or newer, including Windows 11. Traces native x64 processes.
Download MSI installer4.7 MiB COMTracer-1.6.0-x64.msi
Installs the app, MCP server, tracing DLL, demo and documentation. Signed and timestamped by BBSOFT LLC.
02 / PORTABLE
x64 · ZIP archive
Extract the full archive into a folder, then run COMTracer.exe. Keep the executable and tracing DLL together.
Download portable ZIP1.7 MiB COMTracer-1.6.0-x64.zip
Contains the same signed app, MCP server, hook DLL and demo, plus profiles, documentation and dependency licenses.
Verify your download. Compare the package hash with SHA256SUMS.txt. Embedded Windows signatures identify the publisher as BBSOFT LLC.
Release details. Checksums, signing receipts and release notes accompany the official packages.
05 / GET STARTED
Use the included demo to explore a trace before attaching to your application.
Run the MSI, or extract the portable ZIP and open COMTracer.exe. Select Run demo to see sample COM interfaces and Automation methods.
Choose a running x64 process and select Attach, or use Launch… to capture from startup. Run COMTracer elevated when the target runs elevated.
Leave Discover interfaces enabled, import .tlb/.olb files when needed, and use View… to inspect the library catalog. Enable Trace DLL imports for optional DLL function entry events; add calling DLL names under Also trace DLLs.
06 / CAPTURE SCOPE
The tracer needs a live interface obtained through an observed discovery path and a supported method signature. Type libraries and profiles extend coverage; unavailable signatures are not guessed.
The target EXE and selected calling DLLs. Standard MSVC delay-load resolution and new GetProcAddress lookups are supported. Function pointers obtained before attachment, custom export resolvers and direct internal calls are outside this mode. Tracing changes returned function-pointer identity. The included README explains scope and cleanup details.
The MSI and portable ZIP include a local MCP server for Windows x64. After installing the MSI, run the command for your client in PowerShell. For the ZIP, use the full path to COMTracerMCP.exe in the extracted folder.
codex mcp add comtracer -- "C:\Program Files\BBSoft LLC\COMTracer\COMTracerMCP.exe"
codex mcp listclaude mcp add --transport stdio --scope local comtracer -- "C:\Program Files\BBSoft LLC\COMTracer\COMTracerMCP.exe"
claude mcp listOpen a new client session, start COMTracerDemo.exe, and ask the agent to trace the demo. Confirm the target and profile in the Windows dialog. Try asking, "Read the next batch of COM events and show each method with its arguments and return value." Ask the agent to disconnect when finished.
COMTRACER / BY BBSOFT LLC
Questions or feedback?
Contact BBSoft LLC for COMTracer inquiries and product support.
support@bbsoftllc.com